Quick and Easy Way to Style Pandas Data Frames
Add these to the beginning of every notebook!


Photo by Mitchell Luo on Unsplash
“Above all else, show the data.” — Edward R. Tufte
As a data scientist or a data analyst or anyone who is crunching numbers on large datasets, Pandas is your go to library in Python. As per the official Pandas website - "Pandas is a fast, powerful, flexible and easy to use open source data analysis and manipulation tool, built on top of the Python programming language." If you are a seasoned Python user engaged in data wrangling one can say - the day starts with Pandas and ends with Pandas 😊
In Pandas during data analysis, when you display the data frame, some display attributes like - how many rows and columns to display, the precision of floats in a data frame, column width, etc. are set to certain default values. Depending upon the tabular data handled (numerical or text) you may want to tweak these default display behavior as per your need. Let's check out few of these default data frame display settings and later on we will see how we can change them as per our requirements.
Display Options and Settings
Pandas has an options API to configure and customize global behavior related to data frame display behavior. The API is composed of five relevant functions. They are as follows:
- get_option()
- set_option()
- reset_option()
- describe_option()
- option_context()
To start with let's create a sample data frame:
import pandas as pd
import numpy as np
x= np.random.randn(70, 5)
pd.DataFrame(x,columns=["A","B","C","D","E"])

Let's see the default no. of rows and columns display settings:
The get_option() function will give you the default settings for display as below:
# check the default no. of rows & columns to be displayed
print(pd.get_option("display.max_rows"))
print(pd.get_option("display.max_columns"))
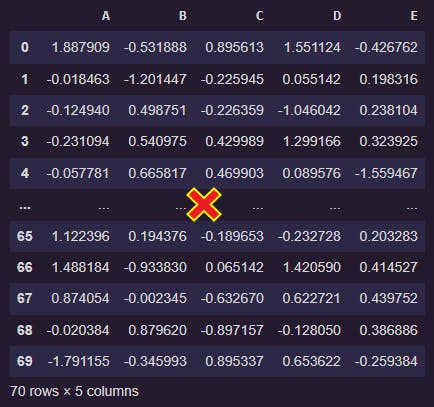
Once you run the above code in Jupyter or Google Colab notebook you will see that the default display setting for no. of rows and columns in Pandas data frame is 60 (rows) & 20 (columns) respectively 🤨 (Ok...the datasets you encounter are way more bigger than just 60 (rows) & 20 (columns) 😲 how can the default settings be changed?🤔). When you display the dataframe, you may not like to see a truncated output - something like👇 (truncated rows)
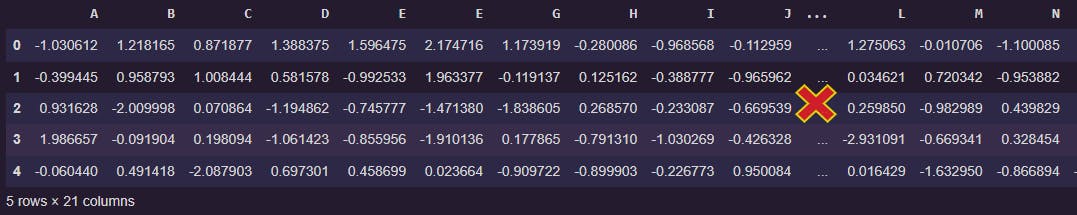
and something like (truncated columns)👇
Sometimes, you want to scroll down or across the data frame to have a better look at the data you are dealing with. In order to do so, simply run either of the two lines below to set your desired no. of rows to be displayed (using the pd.options.display or set_option() method)
# choose no. of rows to be displayed as per your requirement
pd.options.display.max_rows = 999
Or
pd.set_option("display.max_rows", 999)
What about columns? 🙄 Well it's similar for columns with the following line of code:
# choose max no. of columns to display as per your requirement
pd.options.display.max_columns = 100
Or
pd.set_option("display.max_columns", 100)
Restoring the default display settings
There would be instances where you no longer need to use the changed or modified display settings. You can always go back to the default settings with reset_option() method.
You can run pd.reset_option('all') and revert to default settings for all attributes or alternatively run pd.reset_option("display.max_rows") to get back to default setting of 60 rows and pd.reset_option("display.max_columns") for default setting of 20 columns respectively.
😁👍Ok so far so good, you start to think what more changes can be done.🤔
What if a column contains text data? 🙄
Well, say you are working on sentiment analysis and analyzing a dataset with text columns e.g. Twitter data (tweets) or an article/book/movie/customer review, by default, Pandas only display content in a cell with a maximum width of 50 characters. Run this code below and you will see the default setting for maximum no. of characters in a cell.
print(pd.get_option("display.max_colwidth"))
Oh, it's 50 characters right! Ok, now you want to see more text content in a cell. Change the width of the cell as per your requirement with either of the code below 👇 (both perform the same function)
# choose max_colwidth parameter as per your requirement
pd.set_option("max_colwidth", 80)
Or
pd.options.display.max_colwidth = 80
As mentioned earlier, you can always go back to the default settings using the reset_option() method.
What more?🤨 ok, let's set output display in terms of decimal places
By default, Pandas only display 6 digits after the decimal point (if you notice the sample dataframe we generated in the beginning has 6 digits after the decimal or is a 6 decimal places value). You can check the default setting for decimal places by running the code below👇 and you should get 6 as output.
# check decimal places default setting
print(pd.get_option("display.precision"))
Ok, so you got 6 above👍 as output, but you want to change the no. of decimal places to 2. Run either of the following code below (both perform the same function) to change the no. of decimal places with display.precision attribute.
# set no. of decimal places as per your requirement
pd.set_option("display.precision", 2)
Or
pd.options.display.precision = 2
If you refresh your data frame you will now see 2 decimal places values instead of default value of 6 decimal places. Note that this won’t affect the actual numbers to be used in your algorithm, because it is just for display purpose.👍
Some more number formatting😎
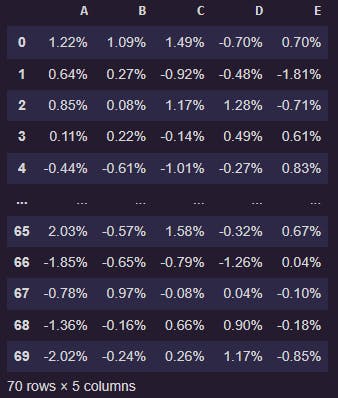
Let’s say the numbers in the data frame we generated above should be percentages, and we want only 2 digits after the decimal point.
We can use pd.options.display.float_format with string formatting to set the display format as below👇
pd.options.display.float_format = '{:.2f}%'.format
Available options
If you are still reading👀, You can get a list of available options and their descriptions with describe_option(). When called with no argument describe_option() will print out the descriptions for all available options.
# will print out the descriptions for all available options
pd.describe_option()
Modify options only for a specific section of your code
option_context() method as a context manager (with statement), let's you modify options for a particular section of your code and then resets options back to default values. This is very handy when you do not want to make global changes in your code.

These are some of the basic but useful display options one should be using in day to day data wrangling/data presentation tasks. However, there are lots of options which can be explored based upon an individual's requirement. I leave you with some broader coverage of the topic as additional reading here👇below
Most of the times, you may want to share your findings with someone else, or you may want to view a pretty, neat and clean data frame for yourself. It is a good practice and very important for effective presentation of data. The raw data you get is often messier than expected🤦♂️. As a best practice, try to keep all these options at the beginning of the notebook so that you do not have to run these lines intermittently as and when required.
Thanks for your patience😊 and pls do share in comments, if you have tried any of these and some more options in your day to day data munging tasks.